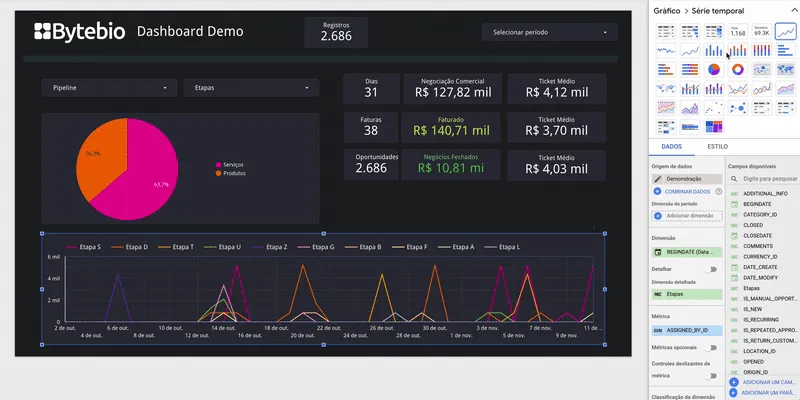
A case of use of Dashboards e data analysis for Business Intelligence in a service company it could be the performance analysis of marketing campaigns, sales, team performance and other relevant metrics collected through the CRM Bitrix24.
To begin with, you would need to connect the Bitrix24 to one Business Intelligence tool, such as Google Data Studio or Looker Studio. We could then create a custom dashboard that aggregates all relevant data and allows for easy, intuitive visualization of the information.
For example, we could create a pie chart showing the distribution of leads generated from different marketing channels, such as social media, paid ads, and emails. This would help identify which channels are generating the most leads and allocate marketing resources more efficiently.
Additionally, we could analyze lead-to-sales conversion rates, average sales value, and total revenue generated per period. This would help us understand overall sales performance and identify areas of opportunity to increase revenue.
It would also be important to analyze the performance of the sales team, including metrics such as the number of calls made, the average response time to leads and the number of closed deals. This would help identify the best salespeople and understand where the team can improve.
Finally, we could include communication analytics such as average email response time and marketing email open rate. This would help us evaluate the effectiveness of communication with customers and prospects and adjust our communication strategies accordingly.
In short, the combination of a CRM like Bitrix24 Using a Business Intelligence tool like Google Data Studio or Looker Studio can be extremely valuable for service companies. The data collected can be used to improve marketing and sales efficiency, identify areas of opportunity to increase revenue, and improve communication with customers and prospects.